   |
|
  |

![]()
![]()
![]()
![]()
![]()
![]()
![]()
![]()
![]()
![]()
|
ResultsAccuracy of remotely sensed digital terrain models (DTMs) under forest canopy
An important question that was investigated was the accuracy of ground surface
models or DTMs generated from LIDAR and IFSAR data. This DTM accuracy
influences the estimation of any vertical vegetation structure variables. To
address this question, a network of three-hundred and forty-seven (347) high
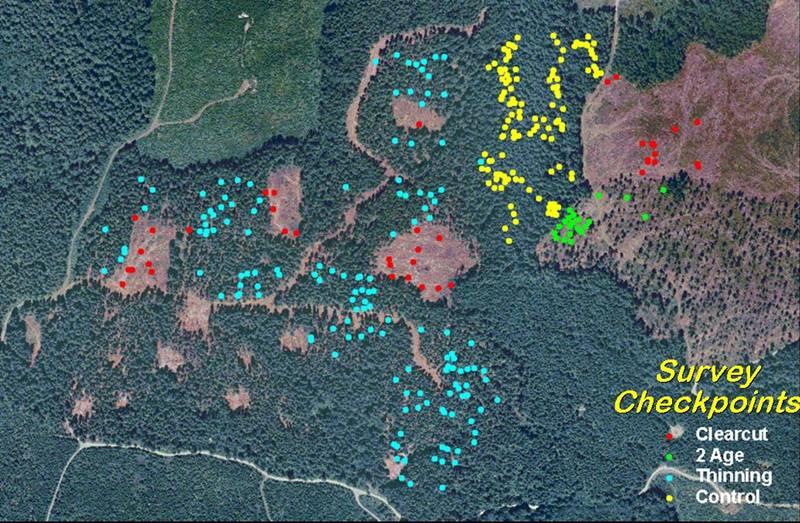
accuracy topographic check points (Figure 4) was established at the Blue Ridge
study site by the Washington Department of Natural Resources, PNW Research
Station, and the University of Washington under stands with varying forest
canopy densities (clearcut (0 trees per hectare (TPH)), heavily-thinned (40
TPH), lightly-thinned (175 TPH), and uncut (280 TPH)). After a least-squares
adjustment of the survey network, the accuracy of the check points was 15 cm
(horizontal) and 3 cm (vertical). The accuracy of the LIDAR- and IFSAR-derived
digital terrain models (Figure 5) acquired at the Blue Ridge site was assessed
via comparison to the topographic checkpoints (Reutebuch et al., 2003;
Andersen et al. 2005a).
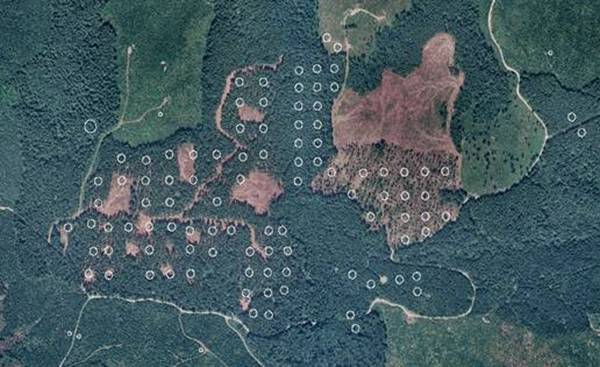
Figure 4. Orthophotograph, Blue Ridge site. Dots indicate the location of ground-surveyed elevation checkpoints. Accuracy of LIDAR-derived DTM under forest canopyThe mean LIDAR DTM error over the entire site was 0.22 ± 0.24 m (mean ± SD), with a root-mean-square-error (RMSE) of 0.32 m. The DTM error increased slightly with increased canopy density but the differences were strikingly small and of virtually no practical significance. In general, the LIDAR DTM was found to be extremely accurate even under very dense conifer stands that are characteristic of Pacific Northwest forests.
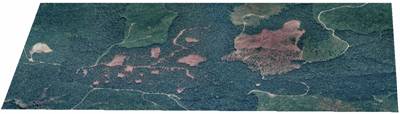
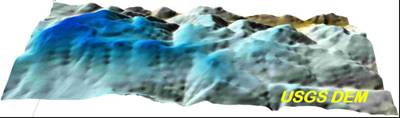
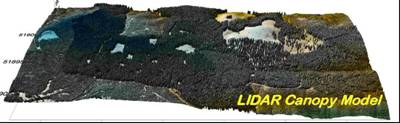
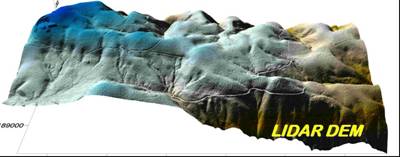
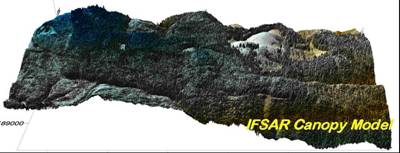
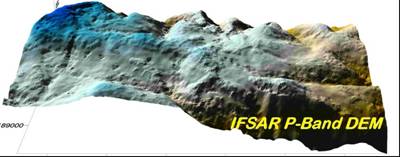
Figure 5. 1999 orthophotograph (a); 1999 LIDAR canopy surface model (b); 2002 IFSAR canopy surface model (c); USGS 10m resolution DTM (d); LIDAR 1m resolution DTM (e); IFSAR 1m resolution DTM (f), Blue Ridge site. Accuracy of IFSAR-derived DTM under forest canopyThe accuracy of a P-band IFSAR-derived DTM was also assessed via comparison to these high-accuracy topographic check points (Andersen et al, 2005a). Low-frequency P-band radar energy physically penetrates through the vegetation canopy and reflects from the underlying terrain surface (Andersen et al., 2006). The mean error of the P-band DTM was -0.28 ± 2.59 m (RMSE = 2.6 m), and the accuracy of the DTM did degrade in areas with higher canopy density. However, the accuracy of the P-band DTM was significantly higher than that of the standard USGS 10-meter DTM available for this area (RMSE = 8.8 m). It should be noted that the availability of P-band IFSAR data in the contiguous United States will be limited due to restrictions on frequencies imposed by the Federal Communication Commission (FCC). Estimating canopy fuels parameters using LIDAR dataA methodology was developed to estimate several critical forest canopy fuel parameters using LIDAR data and ground vegetation plot data (Andersen et al., 2005b). At the Blue Ridge study site, canopy fuel parameters were measured at 101 fixed area field inventory plots established in 1999 and 2003 over a range of stand conditions (Figure 6). Field-based estimates of canopy fuel parameters, including canopy height, canopy base height, canopy bulk density, and canopy fuel weight, were generated using the methodology developed for the Fire and Fuels Extension to the Forest Vegetation Simulator (FFE-FVS). Multiple regression analysis was used to develop the mathematical relationships between the plot-level fuel parameters and a number of LIDAR-derived structural metrics. A leave-one-out cross validation procedure was used to assess the predictive value of each regression model.
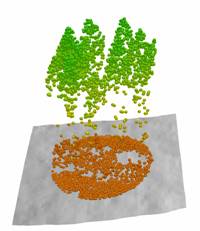
Figure 6. Location of field plots (white circles) at Blue Ridge study site (a) and example of LIDAR point cloud within 1/5th acre plot (b). Strong relationships between LIDAR-derived metrics and field-based fuel estimates were found for all parameters [sqrt(canopy fuel weight): R2=0.86; ln(crown bulk density): R2=0.84; canopy base height: R2=0.77; canopy height: R2=0.98]. Figure 7 illustrates correlations between LIDAR-derived and ground measured canopy fuel variables at Blue Ridge. In another study, this same methodology was used to estimate several important inventory parameters at the plot level at the Blue Ridge site [sqrt(basal area): R2=0.91; sqrt(stem volume): R2=0.92; dominant height: R2=0.96; sqrt(biomass): R2=0.91] (Andersen et al., 2005).
Figure 7. Scatter plots showing correlations between field- and LIDAR-based estimates of canopy fuel variables at Blue Ridge site. Lines represent 1:1 relationship. A similar approach has been used to estimate canopy fuel parameters at the Mission Creek (FFS) site. The results of an analysis comparing the results obtained at the Blue Ridge and Mission Creek sites will be reported in a future paper (Andersen et al., in prep). The predictive models developed in these analyses will be provided in the equation library of the Canopy Fuels Estimator tool (described below in the LIDAR & IFSAR Tools of this report). Estimating canopy fuel parameters using IFSAR dataA similar approach was used to estimate inventory and fuel parameters using dual-frequency X-/P-band IFSAR data acquired over the Blue Ridge site in 2002 (Andersen et al., 2004a). Multiple regression was used to develop mathematical models relating a number of IFSAR-derived variables [canopy height (X-band canopy surface elevation minus P-band ground surface elevation), X-band coherence, X-band backscatter, P-band VV backscatter, P-band VH backscatter, P-band HH backscatter, P-band coherence, and IFSAR-derived canopy density] and plot-level canopy fuel estimates. The correlations between IFSAR observables and canopy fuel variables were generally quite high (canopy height: R2=0.89; canopy base height: R2=0.85; canopy bulk density: R2=0.74; canopy fuel weight: R2=0.77). Due to the FCC restrictions on radar frequencies, we were not able to collect dual-frequency (X-/P-band) IFSAR data over the Mission Creek site. However, high resolution X-band data were collected over Mission Creek in 2005. In order to evaluate the influence of interferometric processing and flying height on the quality of the canopy height information provided by X-band IFSAR, the vendor (Intermap Technologies Inc.) delivered elevation data acquired at two different flying heights and processed the data using four different levels of interferogram filtering. A subsequent analysis of these data and comparison to high resolution LIDAR data found that differences in flying heights and levels of interferogram filtering had little effect on the accuracy of canopy height measurements, while sensing geometry can have a significant effect on the quality of IFSAR-derived canopy measurements (Andersen et al., 2006; Andersen et al., in prep). These results suggest that the typical mission parameters used for high resolution IFSAR topographic survey may also be adequate for forest monitoring applications, and also support the conclusion that acquiring data from multiple look directions may be the most important consideration in the planning of IFSAR flights for forest mapping applications. |
|
|