   |
|
  |

![]()
![]()
![]()
![]()
![]()
|
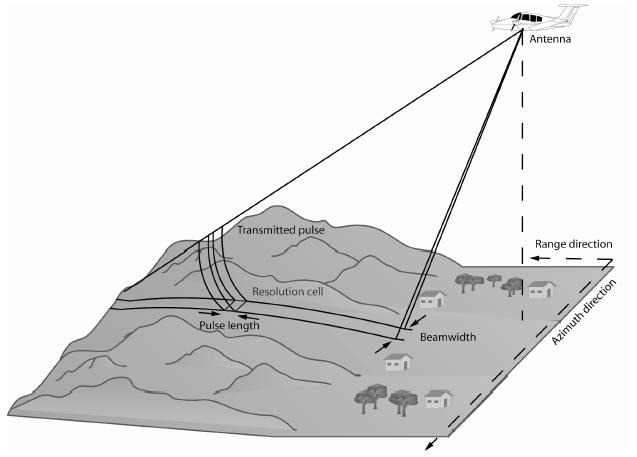
RADAR OverviewSide-looking airborne RADAR (SLAR) is an active imaging technology that operates in the microwave portion of the electromagnetic spectrum1. SLAR operates on the principle of emitting short pulses of microwave energy and recording the reflection from a given area on the ground. The resolution of a side-looking RADAR imaging system in the cross-track direction (i.e. perpendicular to the flight path) is determined by the pulse duration (shorter pulse = higher across-track resolution), while the resolution of the RADAR in the azimuth direction (parallel to flight direction) is determined by the length of the antenna aperture (i.e. longer aperture = higher azimuth resolution) (Figure 1). Because practical considerations will limit the length of a real aperture, in synthetic aperture RADAR (SAR) imaging a very long aperture is synthesized through integration of the magnitude and phase information of the returned echoes from a feature over the entire time it is in view of the RADAR (Waring et al. 1995). Because relatively long-wavelength RADAR energy penetrates through (even dense) water vapor, RADAR imaging is often possible in situations where optical sensing is severely limited or even impossible due to persistent cloud cover. The strength of the signal received by RADAR antenna for a given ground resolution cell (represented by RADAR backscatter coefficient σº) is mainly a function of the wavelength of the microwave energy, the characteristics of the imaged feature, and the geometry of the image acquisition (Jensen, 2000).
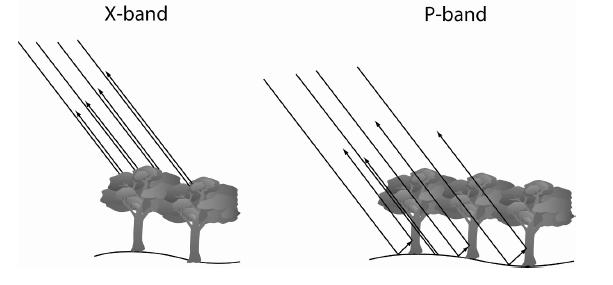
Figure 1. Geometry of a side-looking airborne RADAR system. Adapted from Lillesand and Kiefer (1987). In the context of forest vegetation mapping, the wavelength of the RADAR system will determine whether the SAR backscatter is dominated by surface scattering or volume scattering. When relatively short-wavelength (i.e. 3 cm for X-band) microwave energy interacts with the surface of the forest canopy, the energy is scattered by small-scale components of the canopy, such as the foliage and small branches. Therefore at these wavelengths the RADAR energy reflects mainly from the surface of the canopy (Figure 2). In contrast, RADAR energy with relatively long wavelengths (i.e. 74 cm for P-band) will penetrate into the canopy and reflect from large scale components composing the canopy, including large branches, stems, and the terrain surface. Therefore for long wavelength RADAR systems the reflectance is dominated by volume scattering from large-scale canopy features and surface scattering from the terrain surface (Figure 2). The magnitude of RADAR backscatter (i.e. reflection) from a feature is also dependent upon a variety of surface characteristics, including structure, surface roughness, and water content. In addition, some SAR systems have the capability to send and receive energy with different polarizations. Because RADAR energy can be depolarized upon interaction with various surface features, independently recording the reflection of like-polarized energy (e.g. vertical send – vertical receive (VV) or horizontal send – horizontal receive (HH)) and cross-polarized energy (e.g. vertical send – horizontal receive (VH) or horizontal send – vertical receive (HV)) can yield valuable information regarding the characteristics of imaged features, and can be particularly useful in the analysis of vegetation type and structure. For example, if the RADAR energy interacts mainly with single scatterers at the surface of the canopy, the energy is not depolarized and there is a strong reflection of like-polarized energy. In contrast, if the RADAR energy is reflected from multiple scatterers within the canopy structure, it is often depolarized and there is a strong reflection of cross-polarized energy (Jensen 2000). A RADAR image acquired from a system with a particular frequency, polarization, and incidence angle can therefore provide information related to canopy water content, vegetation type, biomass components (foliage, branches, stems), and canopy structure (leaf orientation, leaf area index, main stem geometry and spatial distribution) (Jensen 2000, Carver 1988).
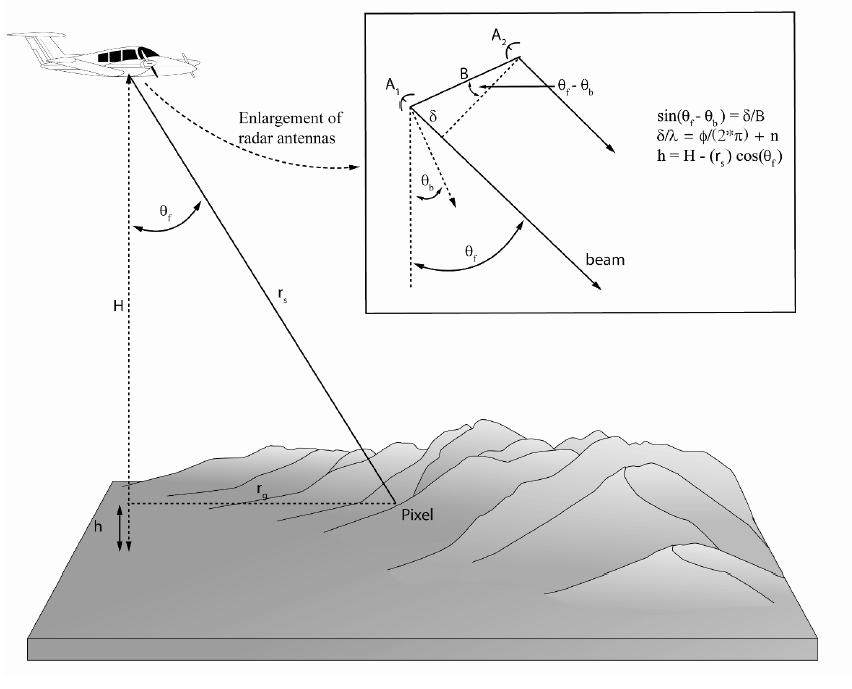
Figure 2. Short wavelength X-band RADAR energy reflects from canopy surface while long wavelength P-band energy penetrates through canopy and reflects from stems and terrain surface Adapted from Moreira et al. (2001). While SAR images can provide important information relating to vegetation properties, the inherently 2D format of the data only allows for indirect estimation of 3D structural attributes within a forested scene. The development IFSAR in recent years has enabled the direct measurement of the elevation of scattering elements within a ground resolution cell. Determining the 3D coordinates of reflecting surfaces using IFSAR involves quantitative analysis of the phase shift between two complex-valued RADAR images obtained with slightly different imaging geometries. The interferometric phase difference at each image point is related to the difference in path length between each antenna and the point, which is a function of surface elevation. This interferometric phase information can be combined with knowledge of the sensing geometry for each antenna to obtain an elevation for each image point (Rosen et al. 2000) (Figure 3). Because the penetration of microwave energy into a forest canopy is a function of RADAR wavelength, the interferometric surface elevation obtained in a forested setting will also be a function of wavelength. For example, the interferometric measurements obtained from an X-band RADAR with a relatively short wavelength will represent the “first-return” surface of the canopy, while the interferometric elevation measurements from a long-wavelength P-band system will generate a surface corresponding to the underlying terrain and understory vegetation.
Figure 3. Geometry of RADAR interferometry. Adapted from Mercer (2004). ReferencesCarver, K.R., 1988, SAR Synthetic Aperture RADAR – Earth Observing System, Vol. IIf, NASA Instrument Panel Report, Washington D.C. Jensen, J.R., 2000, Remote Sensing of the Environment. Prentice-Hall, Upper Saddle River, New Jersey. Lillesand, T., and Kiefer, R., 1987, Remote sensing and image interpretation. Wiley, New York, New York. Mercer, B., 2004, DEMs created from airborne IFSAR – an update. 2004. International Archives of Photogrammetry and Remote Sensing, Vol. XXXV, part B. Istanbul, Turkey. Moreira, J., Schwäbisch, M., Wimmer, C., Rombach, M., and Mura, J., 2001, Surface and ground topography determination in tropical rainforest areas using airborne interferometric SAR, in: Photogrammetric Week '01', Fritsch, D. and R. Spiller, eds. Herbert Wichmann Verlag, Heidelberg. Rosen, P. Hensley, S., Joughin, I., Li, F., Madsen, S., Rodriguez, E., and Goldstein, R., 2000, Synthetic Aperture RADAR Interferometry. Proceedings of the IEEE, Vol. 88, No. 3. Waring, R.H., Way, J.B., Hunt, R., Morrisey, L., Ranson, K.J., Weishampel, J.F., Oren, R., and Franklin, S.E., 1995, Biological toolbox – imaging RADAR for ecosystem studies, BioScience 45: 715-723. ---------- 1 Imaging RADAR systems are operated from both airborne and spaceborne platforms. Spaceborne systems typically have spatial resolutions ranging from 10 - 30 m, while airborne RADAR systems have resolutions from 1-10 meters. |
|
|